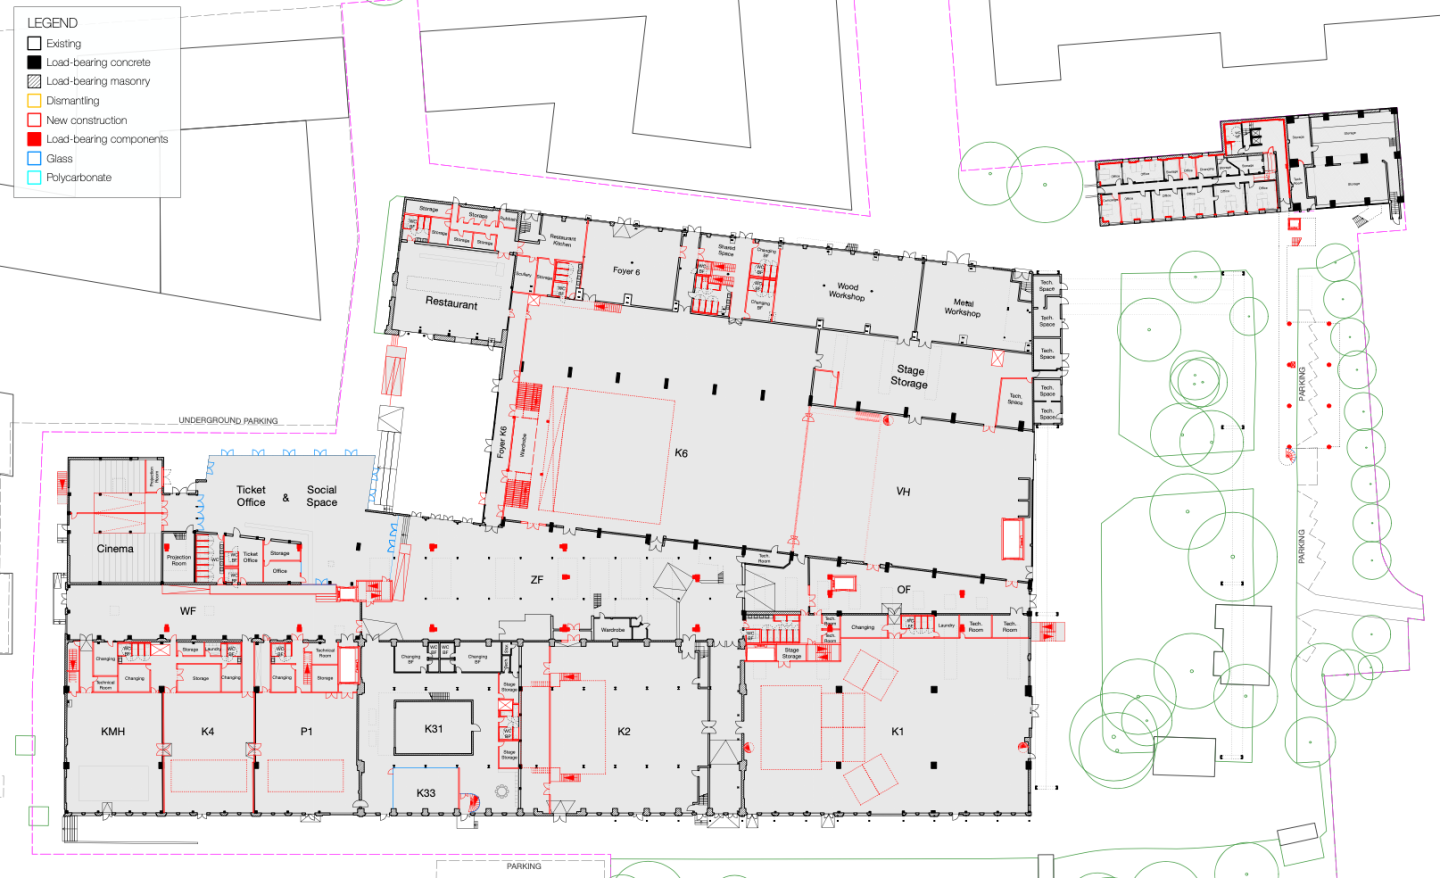
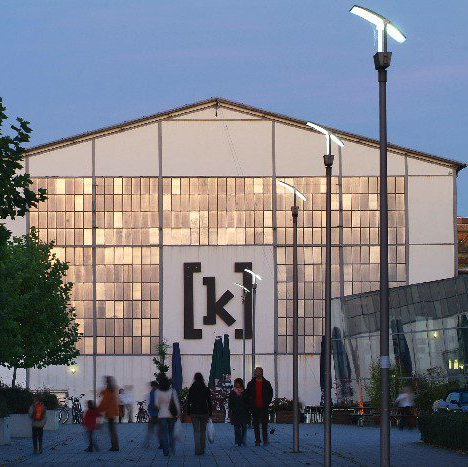
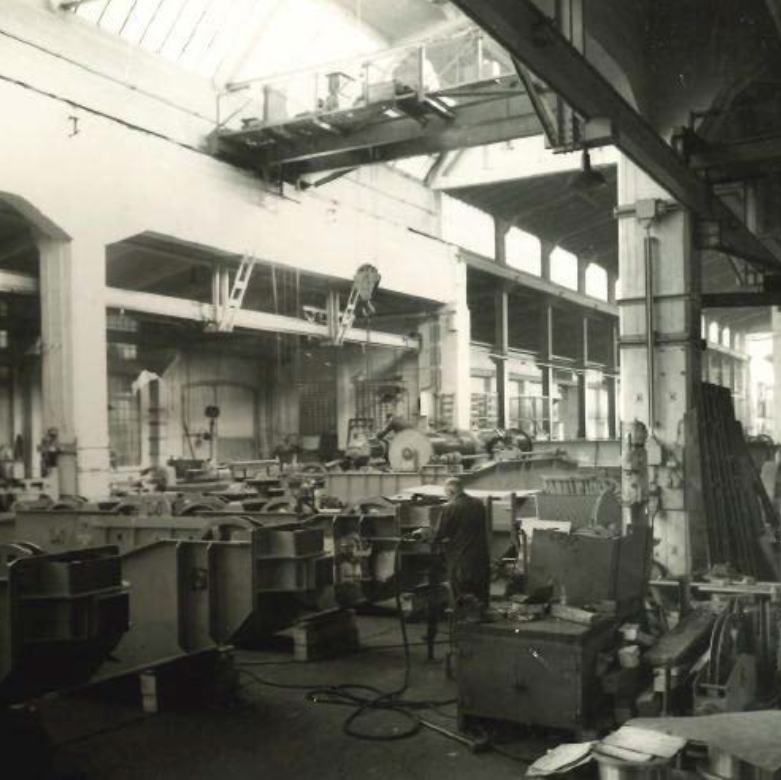
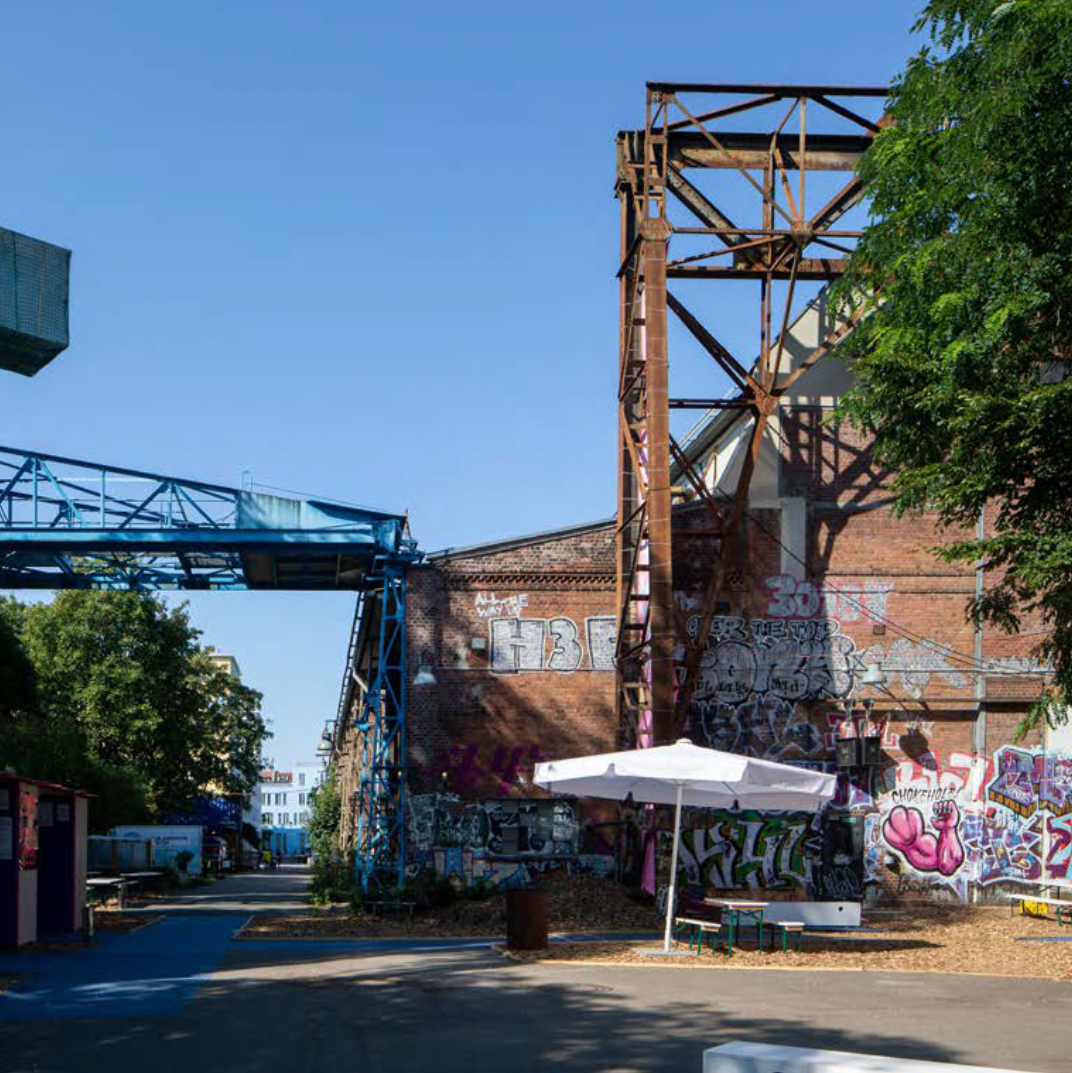
When the Kampnagel company took over temporarily the abandoned industrial naves in the 80’s, they adapted progressively the envelope to host theatre plays. Interventions resulted in glazings that were dark painted, some covered with insulation, others covered with plants. This freedom allowed independent theatre to flourish. However, today the building uses too much energy and needs upgrading. The company planned to insulate the envelope from the interior, which posed a problem to the heritage authorities as the walls are listed.
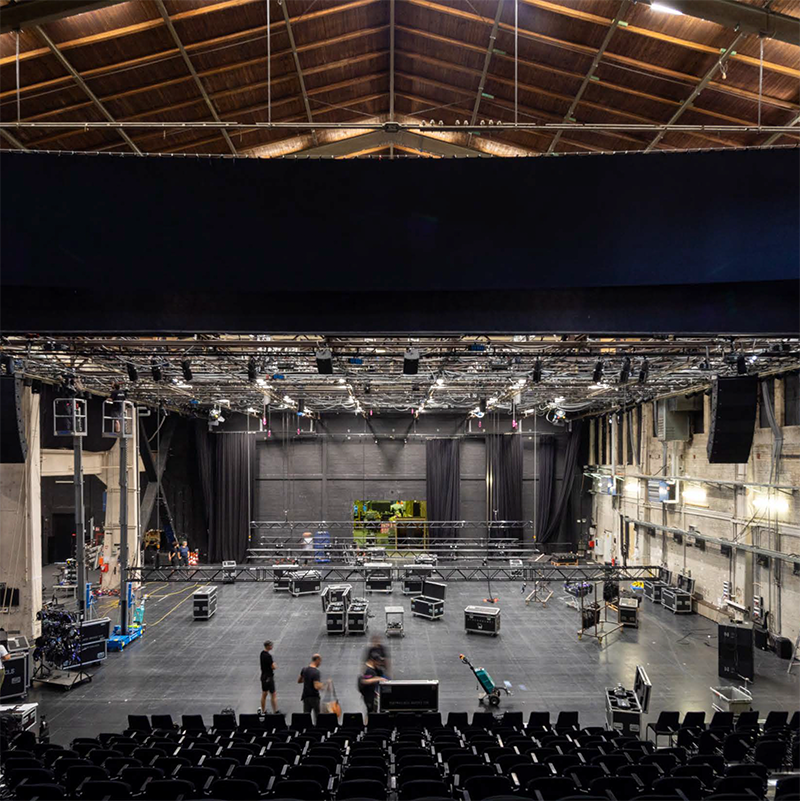
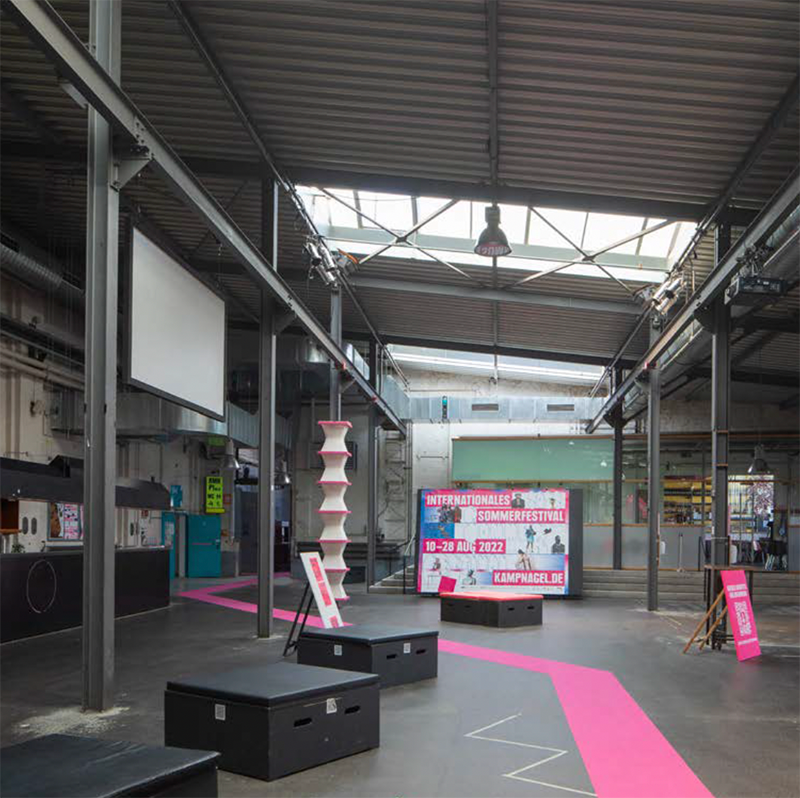
Our task was to reduce the energy consumption whilst keeping the spirit of the building. The team proposed to clear out completely the glazings to bring back the generous daylight of typical industrial buildings. Whilst the plays happen only during ~2-4 hours a week; during rehearsals, montage, and events, the venues can enjoy full daylight. For the plays, thick darkening curtains are provided.
A very precise survey was carried out: envelope components, hourly energy and heating consumption dats during a full year, daily schedules of the venues, with temperature and CO2 surveys from summer and winter, and user interviews. Our computer thermal models were calibrated to reach 87% similarity with reality in temperature, and a 99.7% accuracy in predicting heating consumption. The most valuable outcome was understanding that we could reduce by 80% energy consumption just by regulating properly the heating setpoints.
The rest of the envelope would remain untouched, maintaining the free spirit of the house.
Daylight Autonomy DA [300]
-
0
-
10
-
20
-
30
-
50
-
60
-
70
-
80
-
90
-
100
Daylight Autonomy calculates the percentage of time each point in space receives 300 lux or more naturally.
300 lux gives the impression of a daylit space


Temperature survey


CO2 survey


Thermal model calibration
The scatter plot shows the accuracy of the calibration of the thermal model. It displays correlation between measured and simulated temperature. The R value shows how close the computer model is to real measurements.
The CO2 calibration compares the measured decrease in CO2 with different infiltration values. It shows that the actual infiltration values were 0.0003 m3/(s.m2)


Reduction in heating demand
-
0
-
10
-
20
-
30
-
40
-
50
-
60
-
70
-
80
-
90
-
100
The heating demand represents the energy that the space requires to elevate its temperature to the setpoint (20ºC), regardless of the equipment type.